{
"cells": [
{
"cell_type": "code",
"execution_count": 1,
"id": "1a8b3769",
"metadata": {
"slideshow": {
"slide_type": "skip"
}
},
"outputs": [
{
"data": {
"text/html": [
"\n",
" "
]
},
"metadata": {},
"output_type": "display_data"
}
],
"source": [
"def hide_code_in_slideshow(): \n",
" from IPython import display\n",
" import binascii\n",
" import os\n",
" uid = binascii.hexlify(os.urandom(8)).decode() \n",
" html = \"\"\"\n",
" \"\"\" % (uid, uid)\n",
" display.display_html(html, raw=True)\n",
"\n",
"hide_code_in_slideshow() "
]
},
{
"cell_type": "code",
"execution_count": 2,
"id": "7743e289",
"metadata": {
"slideshow": {
"slide_type": "skip"
}
},
"outputs": [
{
"ename": "ModuleNotFoundError",
"evalue": "No module named 'matplotlib'",
"output_type": "error",
"traceback": [
"\u001b[1;31m---------------------------------------------------------------------------\u001b[0m",
"\u001b[1;31mModuleNotFoundError\u001b[0m Traceback (most recent call last)",
"\u001b[1;32m~\\AppData\\Local\\Temp/ipykernel_7232/945251201.py\u001b[0m in \u001b[0;36m\u001b[1;34m\u001b[0m\n\u001b[0;32m 1\u001b[0m \u001b[1;31m#!pip install scikit-fuzzy\u001b[0m\u001b[1;33m\u001b[0m\u001b[1;33m\u001b[0m\u001b[0m\n\u001b[0;32m 2\u001b[0m \u001b[1;33m\u001b[0m\u001b[0m\n\u001b[1;32m----> 3\u001b[1;33m \u001b[0mget_ipython\u001b[0m\u001b[1;33m(\u001b[0m\u001b[1;33m)\u001b[0m\u001b[1;33m.\u001b[0m\u001b[0mrun_line_magic\u001b[0m\u001b[1;33m(\u001b[0m\u001b[1;34m'matplotlib'\u001b[0m\u001b[1;33m,\u001b[0m \u001b[1;34m'inline'\u001b[0m\u001b[1;33m)\u001b[0m\u001b[1;33m\u001b[0m\u001b[1;33m\u001b[0m\u001b[0m\n\u001b[0m\u001b[0;32m 4\u001b[0m \u001b[1;33m\u001b[0m\u001b[0m\n\u001b[0;32m 5\u001b[0m \u001b[1;32mimport\u001b[0m \u001b[0mnumpy\u001b[0m \u001b[1;32mas\u001b[0m \u001b[0mnp\u001b[0m\u001b[1;33m\u001b[0m\u001b[1;33m\u001b[0m\u001b[0m\n",
"\u001b[1;32mC:\\Python310\\lib\\site-packages\\IPython\\core\\interactiveshell.py\u001b[0m in \u001b[0;36mrun_line_magic\u001b[1;34m(self, magic_name, line, _stack_depth)\u001b[0m\n\u001b[0;32m 2349\u001b[0m \u001b[0mkwargs\u001b[0m\u001b[1;33m[\u001b[0m\u001b[1;34m'local_ns'\u001b[0m\u001b[1;33m]\u001b[0m \u001b[1;33m=\u001b[0m \u001b[0mself\u001b[0m\u001b[1;33m.\u001b[0m\u001b[0mget_local_scope\u001b[0m\u001b[1;33m(\u001b[0m\u001b[0mstack_depth\u001b[0m\u001b[1;33m)\u001b[0m\u001b[1;33m\u001b[0m\u001b[1;33m\u001b[0m\u001b[0m\n\u001b[0;32m 2350\u001b[0m \u001b[1;32mwith\u001b[0m \u001b[0mself\u001b[0m\u001b[1;33m.\u001b[0m\u001b[0mbuiltin_trap\u001b[0m\u001b[1;33m:\u001b[0m\u001b[1;33m\u001b[0m\u001b[1;33m\u001b[0m\u001b[0m\n\u001b[1;32m-> 2351\u001b[1;33m \u001b[0mresult\u001b[0m \u001b[1;33m=\u001b[0m \u001b[0mfn\u001b[0m\u001b[1;33m(\u001b[0m\u001b[1;33m*\u001b[0m\u001b[0margs\u001b[0m\u001b[1;33m,\u001b[0m \u001b[1;33m**\u001b[0m\u001b[0mkwargs\u001b[0m\u001b[1;33m)\u001b[0m\u001b[1;33m\u001b[0m\u001b[1;33m\u001b[0m\u001b[0m\n\u001b[0m\u001b[0;32m 2352\u001b[0m \u001b[1;32mreturn\u001b[0m \u001b[0mresult\u001b[0m\u001b[1;33m\u001b[0m\u001b[1;33m\u001b[0m\u001b[0m\n\u001b[0;32m 2353\u001b[0m \u001b[1;33m\u001b[0m\u001b[0m\n",
"\u001b[1;32mC:\\Python310\\lib\\site-packages\\decorator.py\u001b[0m in \u001b[0;36mfun\u001b[1;34m(*args, **kw)\u001b[0m\n\u001b[0;32m 230\u001b[0m \u001b[1;32mif\u001b[0m \u001b[1;32mnot\u001b[0m \u001b[0mkwsyntax\u001b[0m\u001b[1;33m:\u001b[0m\u001b[1;33m\u001b[0m\u001b[1;33m\u001b[0m\u001b[0m\n\u001b[0;32m 231\u001b[0m \u001b[0margs\u001b[0m\u001b[1;33m,\u001b[0m \u001b[0mkw\u001b[0m \u001b[1;33m=\u001b[0m \u001b[0mfix\u001b[0m\u001b[1;33m(\u001b[0m\u001b[0margs\u001b[0m\u001b[1;33m,\u001b[0m \u001b[0mkw\u001b[0m\u001b[1;33m,\u001b[0m \u001b[0msig\u001b[0m\u001b[1;33m)\u001b[0m\u001b[1;33m\u001b[0m\u001b[1;33m\u001b[0m\u001b[0m\n\u001b[1;32m--> 232\u001b[1;33m \u001b[1;32mreturn\u001b[0m \u001b[0mcaller\u001b[0m\u001b[1;33m(\u001b[0m\u001b[0mfunc\u001b[0m\u001b[1;33m,\u001b[0m \u001b[1;33m*\u001b[0m\u001b[1;33m(\u001b[0m\u001b[0mextras\u001b[0m \u001b[1;33m+\u001b[0m \u001b[0margs\u001b[0m\u001b[1;33m)\u001b[0m\u001b[1;33m,\u001b[0m \u001b[1;33m**\u001b[0m\u001b[0mkw\u001b[0m\u001b[1;33m)\u001b[0m\u001b[1;33m\u001b[0m\u001b[1;33m\u001b[0m\u001b[0m\n\u001b[0m\u001b[0;32m 233\u001b[0m \u001b[0mfun\u001b[0m\u001b[1;33m.\u001b[0m\u001b[0m__name__\u001b[0m \u001b[1;33m=\u001b[0m \u001b[0mfunc\u001b[0m\u001b[1;33m.\u001b[0m\u001b[0m__name__\u001b[0m\u001b[1;33m\u001b[0m\u001b[1;33m\u001b[0m\u001b[0m\n\u001b[0;32m 234\u001b[0m \u001b[0mfun\u001b[0m\u001b[1;33m.\u001b[0m\u001b[0m__doc__\u001b[0m \u001b[1;33m=\u001b[0m \u001b[0mfunc\u001b[0m\u001b[1;33m.\u001b[0m\u001b[0m__doc__\u001b[0m\u001b[1;33m\u001b[0m\u001b[1;33m\u001b[0m\u001b[0m\n",
"\u001b[1;32mC:\\Python310\\lib\\site-packages\\IPython\\core\\magic.py\u001b[0m in \u001b[0;36m\u001b[1;34m(f, *a, **k)\u001b[0m\n\u001b[0;32m 185\u001b[0m \u001b[1;31m# but it's overkill for just that one bit of state.\u001b[0m\u001b[1;33m\u001b[0m\u001b[1;33m\u001b[0m\u001b[0m\n\u001b[0;32m 186\u001b[0m \u001b[1;32mdef\u001b[0m \u001b[0mmagic_deco\u001b[0m\u001b[1;33m(\u001b[0m\u001b[0marg\u001b[0m\u001b[1;33m)\u001b[0m\u001b[1;33m:\u001b[0m\u001b[1;33m\u001b[0m\u001b[1;33m\u001b[0m\u001b[0m\n\u001b[1;32m--> 187\u001b[1;33m \u001b[0mcall\u001b[0m \u001b[1;33m=\u001b[0m \u001b[1;32mlambda\u001b[0m \u001b[0mf\u001b[0m\u001b[1;33m,\u001b[0m \u001b[1;33m*\u001b[0m\u001b[0ma\u001b[0m\u001b[1;33m,\u001b[0m \u001b[1;33m**\u001b[0m\u001b[0mk\u001b[0m\u001b[1;33m:\u001b[0m \u001b[0mf\u001b[0m\u001b[1;33m(\u001b[0m\u001b[1;33m*\u001b[0m\u001b[0ma\u001b[0m\u001b[1;33m,\u001b[0m \u001b[1;33m**\u001b[0m\u001b[0mk\u001b[0m\u001b[1;33m)\u001b[0m\u001b[1;33m\u001b[0m\u001b[1;33m\u001b[0m\u001b[0m\n\u001b[0m\u001b[0;32m 188\u001b[0m \u001b[1;33m\u001b[0m\u001b[0m\n\u001b[0;32m 189\u001b[0m \u001b[1;32mif\u001b[0m \u001b[0mcallable\u001b[0m\u001b[1;33m(\u001b[0m\u001b[0marg\u001b[0m\u001b[1;33m)\u001b[0m\u001b[1;33m:\u001b[0m\u001b[1;33m\u001b[0m\u001b[1;33m\u001b[0m\u001b[0m\n",
"\u001b[1;32mC:\\Python310\\lib\\site-packages\\IPython\\core\\magics\\pylab.py\u001b[0m in \u001b[0;36mmatplotlib\u001b[1;34m(self, line)\u001b[0m\n\u001b[0;32m 97\u001b[0m \u001b[0mprint\u001b[0m\u001b[1;33m(\u001b[0m\u001b[1;34m\"Available matplotlib backends: %s\"\u001b[0m \u001b[1;33m%\u001b[0m \u001b[0mbackends_list\u001b[0m\u001b[1;33m)\u001b[0m\u001b[1;33m\u001b[0m\u001b[1;33m\u001b[0m\u001b[0m\n\u001b[0;32m 98\u001b[0m \u001b[1;32melse\u001b[0m\u001b[1;33m:\u001b[0m\u001b[1;33m\u001b[0m\u001b[1;33m\u001b[0m\u001b[0m\n\u001b[1;32m---> 99\u001b[1;33m \u001b[0mgui\u001b[0m\u001b[1;33m,\u001b[0m \u001b[0mbackend\u001b[0m \u001b[1;33m=\u001b[0m \u001b[0mself\u001b[0m\u001b[1;33m.\u001b[0m\u001b[0mshell\u001b[0m\u001b[1;33m.\u001b[0m\u001b[0menable_matplotlib\u001b[0m\u001b[1;33m(\u001b[0m\u001b[0margs\u001b[0m\u001b[1;33m.\u001b[0m\u001b[0mgui\u001b[0m\u001b[1;33m.\u001b[0m\u001b[0mlower\u001b[0m\u001b[1;33m(\u001b[0m\u001b[1;33m)\u001b[0m \u001b[1;32mif\u001b[0m \u001b[0misinstance\u001b[0m\u001b[1;33m(\u001b[0m\u001b[0margs\u001b[0m\u001b[1;33m.\u001b[0m\u001b[0mgui\u001b[0m\u001b[1;33m,\u001b[0m \u001b[0mstr\u001b[0m\u001b[1;33m)\u001b[0m \u001b[1;32melse\u001b[0m \u001b[0margs\u001b[0m\u001b[1;33m.\u001b[0m\u001b[0mgui\u001b[0m\u001b[1;33m)\u001b[0m\u001b[1;33m\u001b[0m\u001b[1;33m\u001b[0m\u001b[0m\n\u001b[0m\u001b[0;32m 100\u001b[0m \u001b[0mself\u001b[0m\u001b[1;33m.\u001b[0m\u001b[0m_show_matplotlib_backend\u001b[0m\u001b[1;33m(\u001b[0m\u001b[0margs\u001b[0m\u001b[1;33m.\u001b[0m\u001b[0mgui\u001b[0m\u001b[1;33m,\u001b[0m \u001b[0mbackend\u001b[0m\u001b[1;33m)\u001b[0m\u001b[1;33m\u001b[0m\u001b[1;33m\u001b[0m\u001b[0m\n\u001b[0;32m 101\u001b[0m \u001b[1;33m\u001b[0m\u001b[0m\n",
"\u001b[1;32mC:\\Python310\\lib\\site-packages\\IPython\\core\\interactiveshell.py\u001b[0m in \u001b[0;36menable_matplotlib\u001b[1;34m(self, gui)\u001b[0m\n\u001b[0;32m 3518\u001b[0m \"\"\"\n\u001b[0;32m 3519\u001b[0m \u001b[1;32mfrom\u001b[0m \u001b[0mIPython\u001b[0m\u001b[1;33m.\u001b[0m\u001b[0mcore\u001b[0m \u001b[1;32mimport\u001b[0m \u001b[0mpylabtools\u001b[0m \u001b[1;32mas\u001b[0m \u001b[0mpt\u001b[0m\u001b[1;33m\u001b[0m\u001b[1;33m\u001b[0m\u001b[0m\n\u001b[1;32m-> 3520\u001b[1;33m \u001b[1;32mfrom\u001b[0m \u001b[0mmatplotlib_inline\u001b[0m\u001b[1;33m.\u001b[0m\u001b[0mbackend_inline\u001b[0m \u001b[1;32mimport\u001b[0m \u001b[0mconfigure_inline_support\u001b[0m\u001b[1;33m\u001b[0m\u001b[1;33m\u001b[0m\u001b[0m\n\u001b[0m\u001b[0;32m 3521\u001b[0m \u001b[0mgui\u001b[0m\u001b[1;33m,\u001b[0m \u001b[0mbackend\u001b[0m \u001b[1;33m=\u001b[0m \u001b[0mpt\u001b[0m\u001b[1;33m.\u001b[0m\u001b[0mfind_gui_and_backend\u001b[0m\u001b[1;33m(\u001b[0m\u001b[0mgui\u001b[0m\u001b[1;33m,\u001b[0m \u001b[0mself\u001b[0m\u001b[1;33m.\u001b[0m\u001b[0mpylab_gui_select\u001b[0m\u001b[1;33m)\u001b[0m\u001b[1;33m\u001b[0m\u001b[1;33m\u001b[0m\u001b[0m\n\u001b[0;32m 3522\u001b[0m \u001b[1;33m\u001b[0m\u001b[0m\n",
"\u001b[1;32mC:\\Python310\\lib\\site-packages\\matplotlib_inline\\backend_inline.py\u001b[0m in \u001b[0;36m\u001b[1;34m\u001b[0m\n\u001b[0;32m 4\u001b[0m \u001b[1;31m# Distributed under the terms of the BSD 3-Clause License.\u001b[0m\u001b[1;33m\u001b[0m\u001b[1;33m\u001b[0m\u001b[0m\n\u001b[0;32m 5\u001b[0m \u001b[1;33m\u001b[0m\u001b[0m\n\u001b[1;32m----> 6\u001b[1;33m \u001b[1;32mimport\u001b[0m \u001b[0mmatplotlib\u001b[0m\u001b[1;33m\u001b[0m\u001b[1;33m\u001b[0m\u001b[0m\n\u001b[0m\u001b[0;32m 7\u001b[0m from matplotlib.backends.backend_agg import ( # noqa\n\u001b[0;32m 8\u001b[0m \u001b[0mnew_figure_manager\u001b[0m\u001b[1;33m,\u001b[0m\u001b[1;33m\u001b[0m\u001b[1;33m\u001b[0m\u001b[0m\n",
"\u001b[1;31mModuleNotFoundError\u001b[0m: No module named 'matplotlib'"
]
}
],
"source": [
"#!pip install scikit-fuzzy\n",
"\n",
"%matplotlib inline\n",
"\n",
"import numpy as np\n",
"import skfuzzy as fuzz\n",
"from skfuzzy import control as ctrl"
]
},
{
"cell_type": "markdown",
"id": "00acac82",
"metadata": {
"slideshow": {
"slide_type": "slide"
}
},
"source": [
"# Control Difuso\n",
"\n",
"Es un sistema de control que esta basado en la lógica difusa. \n",
"\n",
" \n",
"\n",
"[Lofti A. Zadeh](https://es.wikipedia.org/wiki/Lotfi_A._Zadeh) desarrollo la lógica difusa. "
]
},
{
"cell_type": "markdown",
"id": "b0236a5d",
"metadata": {
"slideshow": {
"slide_type": "slide"
}
},
"source": [
"# ¿Qué tan mojada esta la ropa?\n",
"\n",
"## Lógica Booleana\n",
"\n",
"- Mojada (_Verdadero_)\n",
"- Seca (_Falso_)\n",
"\n",
"## Lógica Difusa\n",
"\n",
"- Parcialmente Mojada (0.7)\n",
"- Parcialmente Seca (0.3)"
]
},
{
"cell_type": "markdown",
"id": "7437f798",
"metadata": {
"slideshow": {
"slide_type": "slide"
}
},
"source": [
"# Beneficios del control difuso\n",
"\n",
"- No requiere conocer el modelo dinámico del sistema a controlar. Por tanto,\n",
" - No requiere identificar el sistema\n",
" - No necesita aproximar el modelo\n",
" - No necesita linealizarlo. \n",
"- **Pero,**\n",
" - No se conoce bien el sistema"
]
},
{
"cell_type": "code",
"execution_count": 3,
"id": "4d41226b",
"metadata": {
"slideshow": {
"slide_type": "skip"
}
},
"outputs": [],
"source": [
"# https://www.irjet.net/archives/V2/i8/IRJET-V2I8104.pdf\n",
"# https://www.upt.ro/img/files/alegeri_2020/csud/5_Cinci_lucrari_stiintifice_in_extenso_2020-2024.pdf"
]
},
{
"cell_type": "markdown",
"id": "5848d0e9",
"metadata": {
"slideshow": {
"slide_type": "slide"
}
},
"source": [
"# Aplicaciones del control difuso "
]
},
{
"cell_type": "markdown",
"id": "a227ba30",
"metadata": {
"slideshow": {
"slide_type": "slide"
}
},
"source": [
"# Estructura de un controlador difuso\n",
"\n",
"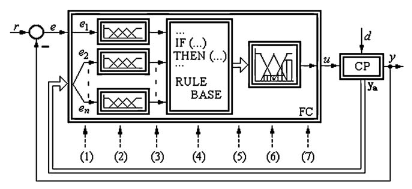\n",
"\n",
"Tomada de [_A survey on industrial applications of fuzzy control_](https://doi.org/10.1016/j.compind.2010.10.001)"
]
},
{
"cell_type": "markdown",
"id": "207c3854",
"metadata": {
"slideshow": {
"slide_type": "slide"
}
},
"source": [
"# Etapas dentro de un controlador difuso\n",
"\n",
"- Valores de Entrada (_crisp inputs_)\n",
"- **Módulo de Fusificación**\n",
"- Entradas difusas\n",
"- **Módulo de Inferencia**\n",
"- Conclusiones difusas\n",
"- **Módulo de Defusificación**\n",
"- Valores de Salida (_crisp outputs_)"
]
},
{
"cell_type": "markdown",
"id": "503a4528",
"metadata": {
"slideshow": {
"slide_type": "slide"
}
},
"source": [
"# Variables lingüísticas / Funciones de membresia\n",
"\n"
]
},
{
"cell_type": "markdown",
"id": "1c31b49c",
"metadata": {
"slideshow": {
"slide_type": "slide"
}
},
"source": [
"# Reglas de Control \n",
"\n",
"Dado un sistema con dos entradas $X$ y $Y$ y una salida $Z$, podemos definir las reglas de control en el modulo de inferencia así:\n",
"\n",
"- Si $X$ es $A_1$ y $Y$ es $B_1$, entonces $Z$ es $C_1$\n",
"- Si $X$ es $A_2$ y $Y$ es $B_2$, entonces $Z$ es $C_2$\n",
"- Si $X$ es $A_3$ y $Y$ es $B_3$, entonces $Z$ es $C_3$"
]
},
{
"cell_type": "markdown",
"id": "d355cc78",
"metadata": {
"slideshow": {
"slide_type": "slide"
}
},
"source": [
"# Modulo de Defusificación\n",
"\n",
"Para la defusificación se pueden usar diferentes métodos:\n",
"\n",
"- Centroide: considera a la función como una función de distribución de masa y busca su centroide. \n",
"- Bisectriz: divide el area bajo la función en dos regiones iguales.\n",
"- Máximo central (MOM _mean of maximum_): toma el promedio de los máximos.\n",
"- Máximo más grande (LOM _largest of maximum_): toma el máximo más grande. \n",
"- Máximo más pequeño (SOM _smallest of maximum_): toma el máximo más pequeño.\n",
"\n",
"[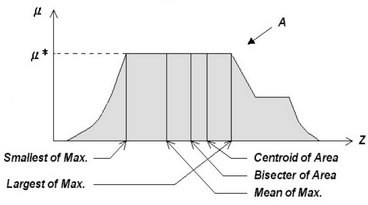](https://www.slideserve.com/erv/hedge)"
]
},
{
"cell_type": "markdown",
"id": "63e6f395",
"metadata": {
"slideshow": {
"slide_type": "slide"
}
},
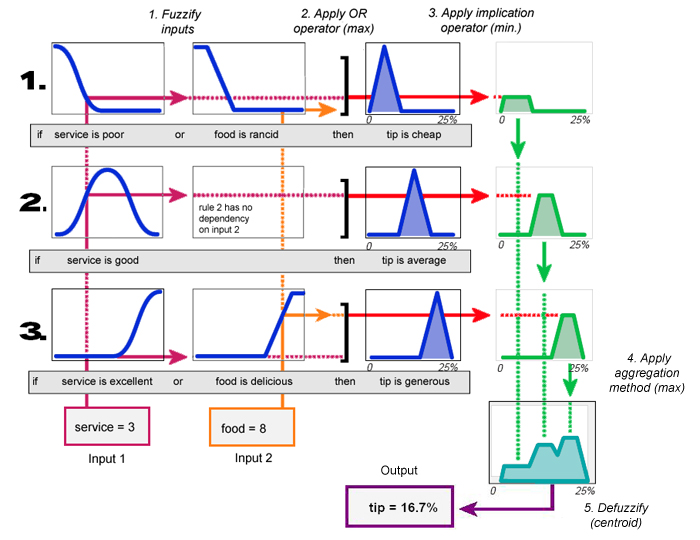
"source": [
"# Modulo de inferencia \n",
"\n",
"Existen diferentes métodos de inferencia, entre ellos: \n",
"\n",
"- Mamdani "
]
},
{
"cell_type": "markdown",
"id": "211cb146",
"metadata": {
"slideshow": {
"slide_type": "slide"
}
},
"source": [
"[](http://www.dma.fi.upm.es/recursos/aplicaciones/logica_borrosa/web/fuzzy_inferencia/mamdanir_en.htm)"
]
},
{
"cell_type": "markdown",
"id": "f419182e",
"metadata": {
"slideshow": {
"slide_type": "slide"
}
},
"source": [
"# Ejemplo : Impresora\n",
"\n",
"Realicemos el control de posición de la impresora via el voltaje del motor con un controlador difuso.\n",
"\n",
"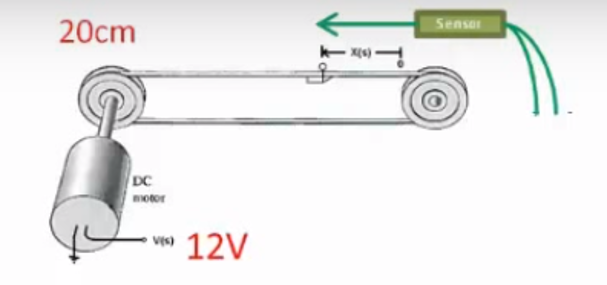\n",
"\n",
"- Variable de entrada : Error de posición\n",
"- Variable de salida : Voltaje del motor"
]
},
{
"cell_type": "markdown",
"id": "a3a17df5",
"metadata": {
"slideshow": {
"slide_type": "slide"
}
},
"source": [
"# Sistema de control\n",
"\n",
""
]
},
{
"cell_type": "markdown",
"id": "208b3f91",
"metadata": {
"slideshow": {
"slide_type": "slide"
}
},
"source": [
"# Reglas de control\n",
"\n",
"- Si el error es NG, entonces el voltaje es NG (negativo grande)\n",
"- Si el error es NP, entonces el voltaje es NP (negativo pequeño)\n",
"- Si el error es C, entonces el voltaje es C (cero)\n",
"- Si el error es PP, entonces el voltaje es PP (positivo pequeño)\n",
"- Si el error es PG, entonces el voltaje es PG (positivo grande)\n"
]
},
{
"cell_type": "markdown",
"id": "244a1016",
"metadata": {
"slideshow": {
"slide_type": "slide"
}
},
"source": [
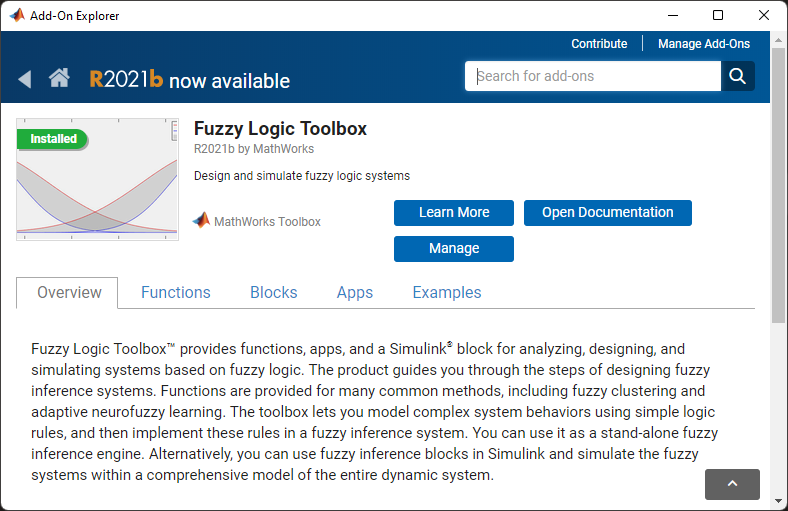
"# En MATLAB \n",
"\n",
"Usaremos la aplicación _fuzzy logic designer_, debemos tener instalado el _Fuzzy Logic Toolbox_\n",
"\n",
""
]
},
{
"cell_type": "markdown",
"id": "9c30a1fb",
"metadata": {
"slideshow": {
"slide_type": "slide"
}
},
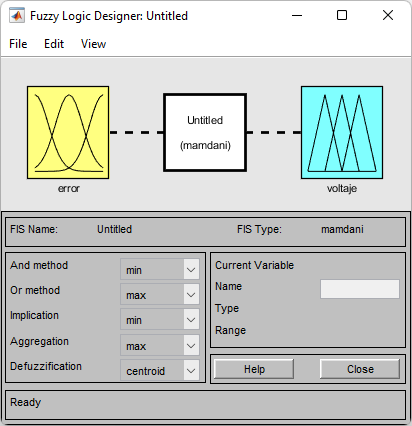
"source": [
"# Fuzzy logic designer\n",
"\n",
"Esta es la ventana inicial, donde definiremos la variable de entrada como el error y la variable de salida como el voltaje. \n",
"\n",
""
]
},
{
"cell_type": "markdown",
"id": "11d57d70",
"metadata": {
"slideshow": {
"slide_type": "slide"
}
},
"source": [
"# Funciones de membresia\n",
"\n",
"Cambiar los valores de error en posición\n",
"\n",
"- ENG = (Range -20, 20, Type: Trapmf, Params: -20 -20 -10 – 5)\n",
"- ENP = (Range -20, 20, Type: Trimf, Params: -10 -5 -0 )\n",
"- EC = (Range -20, 20, Type: Trimf, Params: -5 -0 5 )\n",
"- EPP = (Range -20, 20, Type: Trimf, Params: 0 5 10 )\n",
"- EPG = (Range -20, 20, Type: Trápmf, Params: 5 10 20 20 )\n"
]
},
{
"cell_type": "markdown",
"id": "9d81d2bd",
"metadata": {
"slideshow": {
"slide_type": "slide"
}
},
"source": [
"# Funciones de membresia\n",
"\n",
"Cambiar los valores de voltaje\n",
"\n",
"- VNG = (Range -12, 12, Type: Trapmf, Params: -12 -12 -6 – 3)\n",
"- VNP = (Range -12, 12, Type: Trimf, Params: -6 -3 -0 )\n",
"- VC = (Range -12, 12, Type: Trimf, Params: -3 -0 3 )\n",
"- VPP = (Range -12, 12, Type: Trimf, Params: 0 3 6 )\n",
"- VPG = (Range -12, 12, Type: Trapmf, Params: 3 6 12 12 )\n"
]
},
{
"cell_type": "markdown",
"id": "385f9bde",
"metadata": {
"slideshow": {
"slide_type": "slide"
}
},
"source": [
"# Añadir reglas de control \n",
"\n",
"- Vamos a edit y buscamos el término _Rules_.\n",
"- Emparejamos las entradas y salidas correspondientes con el bóton \"Add rule\"\n",
"- Cuando hayamos terminado cerramos la ventana.\n",
"- Seleccionamos el metodo de fusificación. \n",
"- Exportamos las reglas. "
]
},
{
"cell_type": "markdown",
"id": "016b7c46",
"metadata": {
"slideshow": {
"slide_type": "slide"
}
},
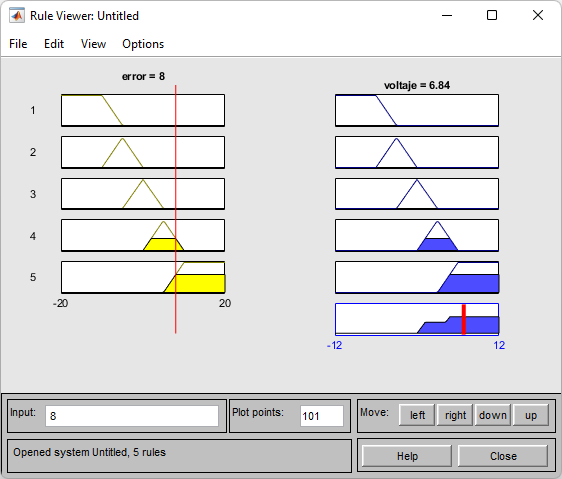
"source": [
"# Visualización de las reglas\n",
"\n",
""
]
},
{
"cell_type": "markdown",
"id": "19fedf9d",
"metadata": {
"slideshow": {
"slide_type": "slide"
}
},
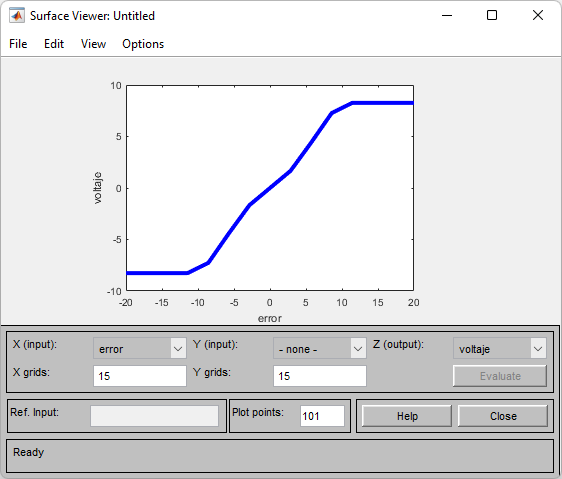
"source": [
"# Visualización de la superficie de control\n",
"\n",
""
]
},
{
"cell_type": "markdown",
"id": "234deb4c",
"metadata": {
"slideshow": {
"slide_type": "slide"
}
},
"source": [
"# Archivos para Matlab\n",
"\n",
"- [Controlador difuso](/matlab/fuzzy/impresora.fis)\n",
"- [Simulink](/matlab/fuzzy/impresora.slx)"
]
}
],
"metadata": {
"celltoolbar": "Slideshow",
"kernelspec": {
"display_name": "Python 3 (ipykernel)",
"language": "python",
"name": "python3"
},
"language_info": {
"codemirror_mode": {
"name": "ipython",
"version": 3
},
"file_extension": ".py",
"mimetype": "text/x-python",
"name": "python",
"nbconvert_exporter": "python",
"pygments_lexer": "ipython3",
"version": "3.10.0"
}
},
"nbformat": 4,
"nbformat_minor": 5
}
\n",
"\n",
"[Lofti A. Zadeh](https://es.wikipedia.org/wiki/Lotfi_A._Zadeh) desarrollo la lógica difusa. "
]
},
{
"cell_type": "markdown",
"id": "b0236a5d",
"metadata": {
"slideshow": {
"slide_type": "slide"
}
},
"source": [
"# ¿Qué tan mojada esta la ropa?\n",
"\n",
"## Lógica Booleana\n",
"\n",
"- Mojada (_Verdadero_)\n",
"- Seca (_Falso_)\n",
"\n",
"## Lógica Difusa\n",
"\n",
"- Parcialmente Mojada (0.7)\n",
"- Parcialmente Seca (0.3)"
]
},
{
"cell_type": "markdown",
"id": "7437f798",
"metadata": {
"slideshow": {
"slide_type": "slide"
}
},
"source": [
"# Beneficios del control difuso\n",
"\n",
"- No requiere conocer el modelo dinámico del sistema a controlar. Por tanto,\n",
" - No requiere identificar el sistema\n",
" - No necesita aproximar el modelo\n",
" - No necesita linealizarlo. \n",
"- **Pero,**\n",
" - No se conoce bien el sistema"
]
},
{
"cell_type": "code",
"execution_count": 3,
"id": "4d41226b",
"metadata": {
"slideshow": {
"slide_type": "skip"
}
},
"outputs": [],
"source": [
"# https://www.irjet.net/archives/V2/i8/IRJET-V2I8104.pdf\n",
"# https://www.upt.ro/img/files/alegeri_2020/csud/5_Cinci_lucrari_stiintifice_in_extenso_2020-2024.pdf"
]
},
{
"cell_type": "markdown",
"id": "5848d0e9",
"metadata": {
"slideshow": {
"slide_type": "slide"
}
},
"source": [
"# Aplicaciones del control difuso "
]
},
{
"cell_type": "markdown",
"id": "a227ba30",
"metadata": {
"slideshow": {
"slide_type": "slide"
}
},
"source": [
"# Estructura de un controlador difuso\n",
"\n",
"\n",
"\n",
"Tomada de [_A survey on industrial applications of fuzzy control_](https://doi.org/10.1016/j.compind.2010.10.001)"
]
},
{
"cell_type": "markdown",
"id": "207c3854",
"metadata": {
"slideshow": {
"slide_type": "slide"
}
},
"source": [
"# Etapas dentro de un controlador difuso\n",
"\n",
"- Valores de Entrada (_crisp inputs_)\n",
"- **Módulo de Fusificación**\n",
"- Entradas difusas\n",
"- **Módulo de Inferencia**\n",
"- Conclusiones difusas\n",
"- **Módulo de Defusificación**\n",
"- Valores de Salida (_crisp outputs_)"
]
},
{
"cell_type": "markdown",
"id": "503a4528",
"metadata": {
"slideshow": {
"slide_type": "slide"
}
},
"source": [
"# Variables lingüísticas / Funciones de membresia\n",
"\n"
]
},
{
"cell_type": "markdown",
"id": "1c31b49c",
"metadata": {
"slideshow": {
"slide_type": "slide"
}
},
"source": [
"# Reglas de Control \n",
"\n",
"Dado un sistema con dos entradas $X$ y $Y$ y una salida $Z$, podemos definir las reglas de control en el modulo de inferencia así:\n",
"\n",
"- Si $X$ es $A_1$ y $Y$ es $B_1$, entonces $Z$ es $C_1$\n",
"- Si $X$ es $A_2$ y $Y$ es $B_2$, entonces $Z$ es $C_2$\n",
"- Si $X$ es $A_3$ y $Y$ es $B_3$, entonces $Z$ es $C_3$"
]
},
{
"cell_type": "markdown",
"id": "d355cc78",
"metadata": {
"slideshow": {
"slide_type": "slide"
}
},
"source": [
"# Modulo de Defusificación\n",
"\n",
"Para la defusificación se pueden usar diferentes métodos:\n",
"\n",
"- Centroide: considera a la función como una función de distribución de masa y busca su centroide. \n",
"- Bisectriz: divide el area bajo la función en dos regiones iguales.\n",
"- Máximo central (MOM _mean of maximum_): toma el promedio de los máximos.\n",
"- Máximo más grande (LOM _largest of maximum_): toma el máximo más grande. \n",
"- Máximo más pequeño (SOM _smallest of maximum_): toma el máximo más pequeño.\n",
"\n",
"[](https://www.slideserve.com/erv/hedge)"
]
},
{
"cell_type": "markdown",
"id": "63e6f395",
"metadata": {
"slideshow": {
"slide_type": "slide"
}
},
"source": [
"# Modulo de inferencia \n",
"\n",
"Existen diferentes métodos de inferencia, entre ellos: \n",
"\n",
"- Mamdani "
]
},
{
"cell_type": "markdown",
"id": "211cb146",
"metadata": {
"slideshow": {
"slide_type": "slide"
}
},
"source": [
"[](http://www.dma.fi.upm.es/recursos/aplicaciones/logica_borrosa/web/fuzzy_inferencia/mamdanir_en.htm)"
]
},
{
"cell_type": "markdown",
"id": "f419182e",
"metadata": {
"slideshow": {
"slide_type": "slide"
}
},
"source": [
"# Ejemplo : Impresora\n",
"\n",
"Realicemos el control de posición de la impresora via el voltaje del motor con un controlador difuso.\n",
"\n",
"\n",
"\n",
"- Variable de entrada : Error de posición\n",
"- Variable de salida : Voltaje del motor"
]
},
{
"cell_type": "markdown",
"id": "a3a17df5",
"metadata": {
"slideshow": {
"slide_type": "slide"
}
},
"source": [
"# Sistema de control\n",
"\n",
""
]
},
{
"cell_type": "markdown",
"id": "208b3f91",
"metadata": {
"slideshow": {
"slide_type": "slide"
}
},
"source": [
"# Reglas de control\n",
"\n",
"- Si el error es NG, entonces el voltaje es NG (negativo grande)\n",
"- Si el error es NP, entonces el voltaje es NP (negativo pequeño)\n",
"- Si el error es C, entonces el voltaje es C (cero)\n",
"- Si el error es PP, entonces el voltaje es PP (positivo pequeño)\n",
"- Si el error es PG, entonces el voltaje es PG (positivo grande)\n"
]
},
{
"cell_type": "markdown",
"id": "244a1016",
"metadata": {
"slideshow": {
"slide_type": "slide"
}
},
"source": [
"# En MATLAB \n",
"\n",
"Usaremos la aplicación _fuzzy logic designer_, debemos tener instalado el _Fuzzy Logic Toolbox_\n",
"\n",
""
]
},
{
"cell_type": "markdown",
"id": "9c30a1fb",
"metadata": {
"slideshow": {
"slide_type": "slide"
}
},
"source": [
"# Fuzzy logic designer\n",
"\n",
"Esta es la ventana inicial, donde definiremos la variable de entrada como el error y la variable de salida como el voltaje. \n",
"\n",
""
]
},
{
"cell_type": "markdown",
"id": "11d57d70",
"metadata": {
"slideshow": {
"slide_type": "slide"
}
},
"source": [
"# Funciones de membresia\n",
"\n",
"Cambiar los valores de error en posición\n",
"\n",
"- ENG = (Range -20, 20, Type: Trapmf, Params: -20 -20 -10 – 5)\n",
"- ENP = (Range -20, 20, Type: Trimf, Params: -10 -5 -0 )\n",
"- EC = (Range -20, 20, Type: Trimf, Params: -5 -0 5 )\n",
"- EPP = (Range -20, 20, Type: Trimf, Params: 0 5 10 )\n",
"- EPG = (Range -20, 20, Type: Trápmf, Params: 5 10 20 20 )\n"
]
},
{
"cell_type": "markdown",
"id": "9d81d2bd",
"metadata": {
"slideshow": {
"slide_type": "slide"
}
},
"source": [
"# Funciones de membresia\n",
"\n",
"Cambiar los valores de voltaje\n",
"\n",
"- VNG = (Range -12, 12, Type: Trapmf, Params: -12 -12 -6 – 3)\n",
"- VNP = (Range -12, 12, Type: Trimf, Params: -6 -3 -0 )\n",
"- VC = (Range -12, 12, Type: Trimf, Params: -3 -0 3 )\n",
"- VPP = (Range -12, 12, Type: Trimf, Params: 0 3 6 )\n",
"- VPG = (Range -12, 12, Type: Trapmf, Params: 3 6 12 12 )\n"
]
},
{
"cell_type": "markdown",
"id": "385f9bde",
"metadata": {
"slideshow": {
"slide_type": "slide"
}
},
"source": [
"# Añadir reglas de control \n",
"\n",
"- Vamos a edit y buscamos el término _Rules_.\n",
"- Emparejamos las entradas y salidas correspondientes con el bóton \"Add rule\"\n",
"- Cuando hayamos terminado cerramos la ventana.\n",
"- Seleccionamos el metodo de fusificación. \n",
"- Exportamos las reglas. "
]
},
{
"cell_type": "markdown",
"id": "016b7c46",
"metadata": {
"slideshow": {
"slide_type": "slide"
}
},
"source": [
"# Visualización de las reglas\n",
"\n",
""
]
},
{
"cell_type": "markdown",
"id": "19fedf9d",
"metadata": {
"slideshow": {
"slide_type": "slide"
}
},
"source": [
"# Visualización de la superficie de control\n",
"\n",
""
]
},
{
"cell_type": "markdown",
"id": "234deb4c",
"metadata": {
"slideshow": {
"slide_type": "slide"
}
},
"source": [
"# Archivos para Matlab\n",
"\n",
"- [Controlador difuso](/matlab/fuzzy/impresora.fis)\n",
"- [Simulink](/matlab/fuzzy/impresora.slx)"
]
}
],
"metadata": {
"celltoolbar": "Slideshow",
"kernelspec": {
"display_name": "Python 3 (ipykernel)",
"language": "python",
"name": "python3"
},
"language_info": {
"codemirror_mode": {
"name": "ipython",
"version": 3
},
"file_extension": ".py",
"mimetype": "text/x-python",
"name": "python",
"nbconvert_exporter": "python",
"pygments_lexer": "ipython3",
"version": "3.10.0"
}
},
"nbformat": 4,
"nbformat_minor": 5
}